Engineers often treat IMU datasheet numbers as absolute truths — bias stability, ARW, VRW, and scale factor. Yet few realize that these results depend entirely on the IMU testing conditions behind them. Without understanding how those numbers were measured, comparisons between IMUs can be dangerously misleading.
IMU testing conditions determine how realistic and reliable IMU specifications truly are. Temperature, vibration, duration, and filtering all shape what the datasheet claims — and what the sensor actually delivers.
Every IMU parameter hides a story: how long the test lasted, how the sensor was mounted, and how stable the environment was. To interpret specifications correctly, engineers must look beyond the numbers and into the testing conditions that created them.

Table of contents
The Hidden Variable Behind Every IMU Specification
When engineers read an IMU datasheet, they often see precision figures as fixed facts. But each value is the product of a unique set of IMU testing conditions — temperature, motion, duration, and even filter bandwidth. Change any of these, and the results change with it.
For instance, a gyroscope that reports 0.05°/h bias stability during a one-hour static test at 25 °C might show six times that drift once it operates on a UAV exposed to temperature swings and vibration. The sensor hasn’t changed — the environment has. This hidden dependency defines the true meaning of every IMU specification.
Why Testing Temperature Matters More Than You Think
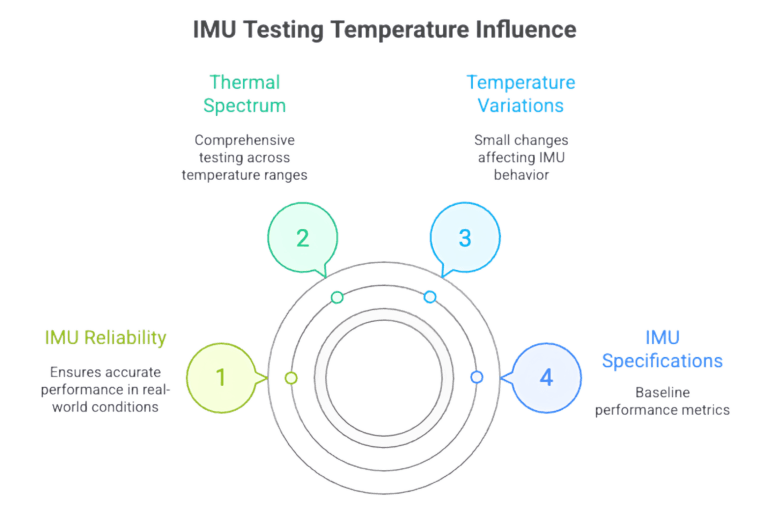
Temperature isn’t just a background variable; it’s one of the most decisive factors in any IMU testing condition. Even small thermal variations can shift bias, alter scale factors, and distort long-term drift results.
When IMU specifications list bias stability or ARW without stating the temperature range, those values represent only a narrow snapshot. A unit stable at 25 °C may double its drift at −20 °C or +70 °C. Real validation covers the entire thermal spectrum, gathering data during both heating and cooling cycles. Only then can IMU specifications represent genuine field reliability rather than laboratory comfort.

The Role of Vibration and Motion Profiles
In real-world platforms, vibration is constant — from engines, propellers, or gearboxes. Standard IMU testing conditions rarely replicate this complexity, yet these are exactly what challenge sensor stability.
An IMU that performs flawlessly on a quiet rate table may drift once mounted on a moving vehicle. Random vibration excites cross-axis coupling, scale-factor distortion, and mechanical stress. If IMU specifications are based only on static data, they fail to predict field behavior. True performance emerges only under dynamic, broadband motion profiles that mimic real operation.
Duration and Data Sampling: The Silent Accuracy Killer
The credibility of any IMU specification depends on how long the test runs and how frequently data is sampled. Short-duration tests often create an illusion of stability, capturing only the most favorable moments of sensor behavior. When IMU testing conditions last just a few minutes, long-term drift and low-frequency noise remain hidden.
A gyroscope that looks stable over 10 minutes may show significant bias creep after an hour. Similarly, a limited sampling rate can suppress high-frequency noise during testing but allow it to reappear later as integration error. Professional-grade evaluation requires hours of data and high-frequency sampling to ensure the reported IMU specifications hold true in extended operation.
Filtering and Allan Variance Analysis
Allan variance analysis is the foundation of modern IMU testing conditions, used to identify bias instability, angle random walk, and noise density. However, results depend strongly on data filtering. Heavy filtering smooths noise but hides real variations, yielding optimistic IMU specifications.
Both analog and digital filters shape the data spectrum. Narrow bandwidth suppresses random noise yet masks real bias fluctuations, while unfiltered data exposes genuine instability. Reliable analysis must disclose filter type, cutoff frequency, and sampling parameters — otherwise, even Allan variance plots can mislead engineers about true IMU performance.

Repeatability vs. Reproducibility in IMU Testing
Consistency is as important as accuracy. Two IMUs may show identical datasheet values yet behave differently in repeated tests. That’s why engineers distinguish repeatability from reproducibility when defining IMU testing conditions.
| Aspect | Repeatability | Reproducibility |
|---|---|---|
| Definition | Same setup, same operator, same environment | Different setups, times, or labs |
| Purpose | Evaluates short-term stability | Evaluates manufacturing consistency |
| Deviation | Typically small (sensor noise) | Larger (includes procedural effects) |
| Relevance | Reflects precision | Reflects long-term reliability |
Without reproducibility checks, even a high-grade IMU may appear flawless in one lab but inconsistent in another. Confidence in IMU specifications comes only when both metrics are verified.
How Laboratory Results Differ from Real-World Conditions
On paper, everything looks perfect — until the IMU leaves the lab. Inside controlled chambers, power supplies are clean, vibration isolated, and interference absent. Once installed on a vehicle or aircraft, those ideal IMU testing conditions vanish.
Humidity, electrical ripple, and mounting stress all affect sensor behavior. These influences never appear on the datasheet, yet they define real performance. That’s why real-world validation — under shock, temperature cycling, and vibration — is essential for turning IMU specifications into dependable engineering data.
Why “Typical” Values Don’t Always Mean “Achievable”
“Typical” values on a datasheet can be deceptive. They represent results achieved under ideal IMU testing conditions, not guaranteed performance. A bias stability of 0.05°/h measured in a static, room-temperature test may degrade dramatically in a field environment.
“Typical” means possible, not promised. Engineers must ask not only what the number is, but how it was obtained. Understanding this distinction separates realistic design expectations from over-optimistic interpretations of IMU specifications.

Establishing a Fair Benchmark for IMU Comparison
Comparing IMUs is only fair when the IMU testing conditions are identical. Temperature range, vibration level, duration, and filter bandwidth must all align. That’s why professional testing follows standards such as IEEE Std 952 or ISO 16063-33, which define consistent methods for measuring bias, scale factor, and ARW.
Without such benchmarks, one supplier’s “tactical-grade” might equal another’s “industrial-grade.” True comparison begins with transparency — disclosing testing duration, filtering parameters, and environmental setup. Only then do IMU specifications reflect engineering reality.
GuideNav’s Approach: Real-World Validation Beyond the Datasheet
At GuideNav, we believe an IMU’s worth is proven in the field, not just the lab. Each product undergoes dual-stage validation: first under controlled IMU testing conditions — temperature cycles, rate tables, and vibration — to establish accurate, repeatable IMU specifications; then in real-world trials involving shock, continuous rotation, and environmental stress.
This process ensures that every number on a GuideNav datasheet reflects data verified in both controlled and operational environments. For us, specifications are not marketing claims — they are measured promises that hold true where it matters most: in mission-critical applications.

